
Why a focused comparison matters
Choosing between suppliers is rarely about a single specification; it’s about how specifications interact under real production demands. A comparative approach forces clarity: throughput vs. shear profile, material compatibility vs. serviceability, and stated power vs. effective dispersion. If you’re evaluating an inline high shear mixer, start by lining up the metrics that will govern your process, not the glossy brochure claims.
Core performance metrics to compare
Measure these first, in this order: maximum shear rate (or tip speed for rotor–stator systems), capacity at target viscosity, and reported residence time distribution. Suppliers often quote peak rpm or horsepower; those figures mean little if torque is inadequate at operating viscosity. Ask for performance curves at viscosities you expect to run and for test data showing particle size distribution after processing under those exact conditions.
Materials, seals and sanitary concerns
Select alloys and seal systems suited to your chemistry. Stainless grades, surface finishes, and O-ring materials matter when acids, solvents, or sanitizing agents are present. For food and pharma, confirm cleanability and documentation that matches your validation needs. A supplier comparison should include finish Ra numbers, weld traceability, and availability of sanitary options without long lead times.
Controls, integration and automation
Compare control philosophies: closed-loop torque control, feedback from inline particle sensors, and PLC compatibility. Integration cost is hidden: a “smart” head that can’t communicate with your historian becomes a manual fix. Prefer suppliers who provide clear I/O maps, deterministic cycle definitions, and proven field integration references.
Service, spare parts and total cost of ownership
List mean time to repair, parts lead times, and local stocking options. A cheap head with a long downtime curve can cost more than a premium unit with rapid support. Request real-world service level agreements and average response times from comparable installations; quantify downtime cost and fold that into your supplier comparison matrix.
Validation, compliance and paperwork
Demand traceable material certificates, FAT documentation, and IQ/OQ templates. Suppliers who supply only generic paperwork force your team to invest time and risk inconsistencies. Prioritize vendors that provide execution-ready protocols aligned to common regulatory expectations and that will support on-site commissioning.
Alternatives and comparative trade-offs
Compare rotor–stator inline heads, colloid mills and ultrasonic homogenizers against your target outcomes. Rotor–stator units give broad shear with lower energy for larger volumes; colloid mills excel at narrow particle size reductions for high-solid loads; ultrasonics deliver very high local energy but struggle with scale and solids handling. Map each technology to your particle size target, solids fraction and acceptable scale-up path before weighting supplier claims.
Common selection mistakes
Don’t accept nominal horsepower as a proxy for capability. Don’t ignore service logistics; don’t assume a bench test scales linearly without confirmation at production viscosity. Avoid buying on spec sheets alone—demand site or pilot trials, documented by both parties, and insist on defined acceptance criteria for those trials.
Experience, evidence and a high-level anchor
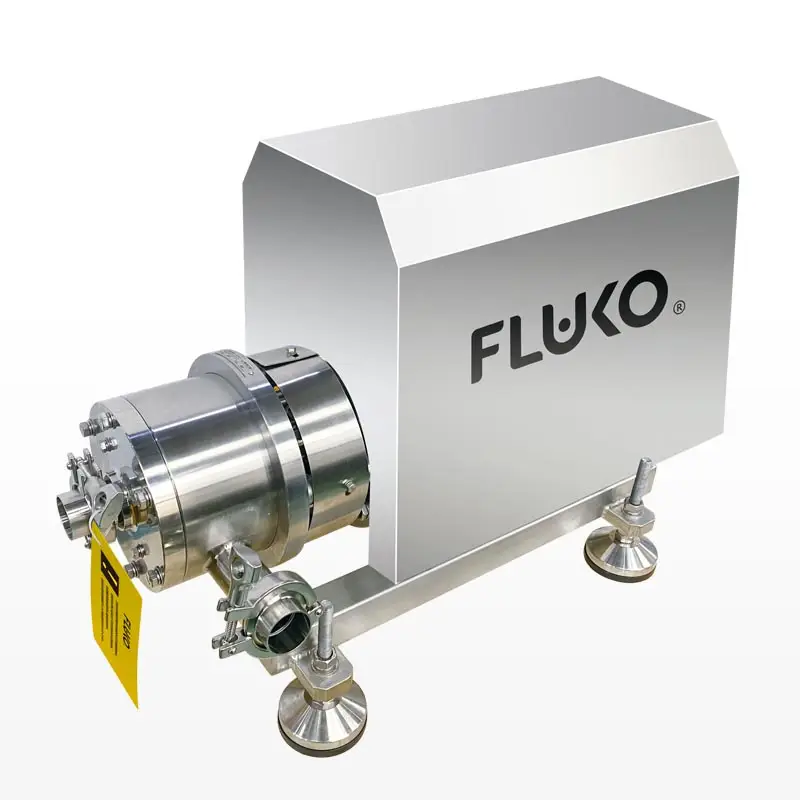
Direct field exposure and documented trial data separate confident suppliers from hopeful vendors. Based on multi-year pilot programs and commissioning work in Basel, Switzerland’s pharmaceutical facilities, engineers have repeatedly observed that verified shear profiles predict product stability and scale behavior more reliably than rpm or power numbers alone—this is why teams in Basel prefer tested high shear inline mixers with formalized acceptance testing. Ask to see the test protocols and raw data; insist that supplier claims be traceable to those records.
How to construct a fair comparison matrix
Create weighted criteria: performance (40%), validation/documentation (20%), service/support (15%), integration (15%), and life-cycle cost (10%). Score suppliers on documented evidence for each item—lab curves, FAT reports, service SLA examples—then run sensitivity checks: how does supplier rank change if downtime cost doubles? If a vendor cannot supply audit-grade evidence, reduce their score accordingly.
Final synthesis
A reasoned comparison exposes where suppliers diverge: engineering transparency, verifiable performance and local support are the decisive differentiators. That clarity points directly to vendors that back their claims with test data, service readiness and integration know-how, which is the practical value a manufacturer like FLUKO brings to technically demanding processes.